This page carries our current read on BTC/USD, rewritten every day from the same data the desk works off: daily candles and moving averages, US spot ETF net flows, perpetual funding and open interest, CME positioning, on-chain network health, and where the market sits in the halving cycle. Bitcoin trades seven days a week, so the levels below are as of the timestamp on the analysis and nothing older is kept on this page.
Bitcoin Market Analysis
BTC Consolidates at $84k Ahead of Oct CPI on 2026-09-26
Updated:
Market Bias
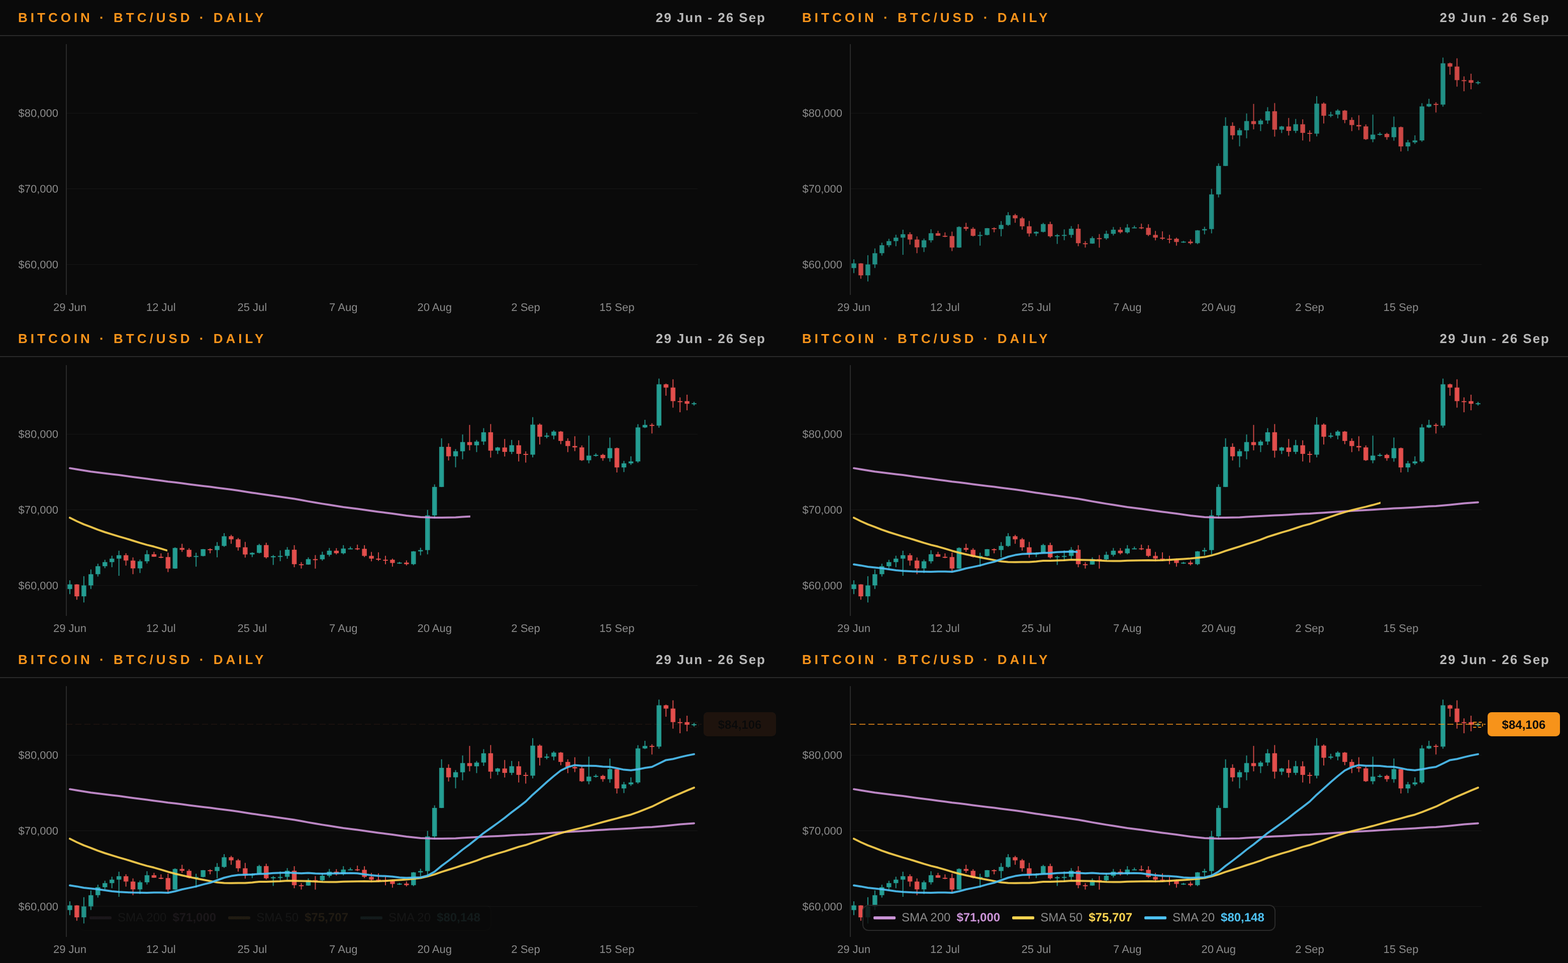
Bullish bias dominates as Bitcoin trades within a strong uptrend, confirmed by price sitting above the SMA 20, SMA 50, and SMA 200. Technical momentum reinforces this view: the RSI sits at 64.30 without entering overbought territory, while the positive MACD histogram indicates sustained buying pressure. This alignment suggests the current upward trajectory remains intact as long as key support levels hold.
Executive Summary
Bitcoin consolidates near $84,105 following a modest 0.08% daily gain, holding firmly above all major moving averages within a sustained uptrend. Weekly performance reflects continued resilience with a 3.54% advance, though the asset remains 33.35% below its all-time high of $126,198. Market momentum is underpinned by robust institutional flows, evidenced by a seven-day streak of positive ETF activity totaling $2.39 billion in net inflows, with BlackRock and Fidelity leading the charge. Derivatives data reveals a bullish skew, as retail traders maintain a net long bias reflected in a 1.30 long-to-short ratio, while funding rates indicate longs paying shorts at a 5.4% annualized level. On-chain metrics show active address growth of 3.77% despite a slight pullback in hashrate. As the Fear & Greed Index registers "Greed" at 74, the immediate catalyst to monitor is the upcoming US Consumer Price Index release on October 14, which may test the current price stability as the broader crypto market cap remains elevated near $2.9 trillion.
Global Context: Liquidity, the Institutional Bid, and Where BTC Sits in the Cycle
The marginal buyer for Bitcoin remains the US spot ETF market, where a seven-day consecutive inflow streak has delivered $2385.8 million to the asset class, with BlackRock's IBIT capturing over half of that volume. This institutional demand operates against a liquidity backdrop defined by a Federal Funds Rate held at 3.63% and a Treasury yield curve inversion narrowing to a 0.360 spread between the 10-year and 2-year notes. While the Fed balance sheet sits at $6,747,704 million, the reverse repo facility remains effectively empty at $0.576 billion, signaling a tight cash environment where institutional capital is being allocated selectively rather than poured in broadly through monetary easing.
Bitcoin currently occupies the early-to-mid phase of its fourth halving epoch, with 81,321 blocks remaining until the next subsidy reduction in April 2028. This positions the asset well beyond the immediate post-halving supply shock but prior to the typical late-cycle liquidity expansion. Valuation metrics like MVRV and NUPL are unavailable, so cycle position relies on the halving progress clock at 61.28%. Crucially, Bitcoin's behavior is decoupling from traditional digital-gold narratives; it tracks equities with a correlation of +0.759 to COIN and +0.801 to MicroStrategy, while maintaining a strong positive link to Ethereum at +0.875. Conversely, its relationship with the Dollar Index has weakened, showing a negative correlation of -0.394, suggesting it is currently pricing in broader risk sentiment more than safe-haven flows.
Technical Analysis
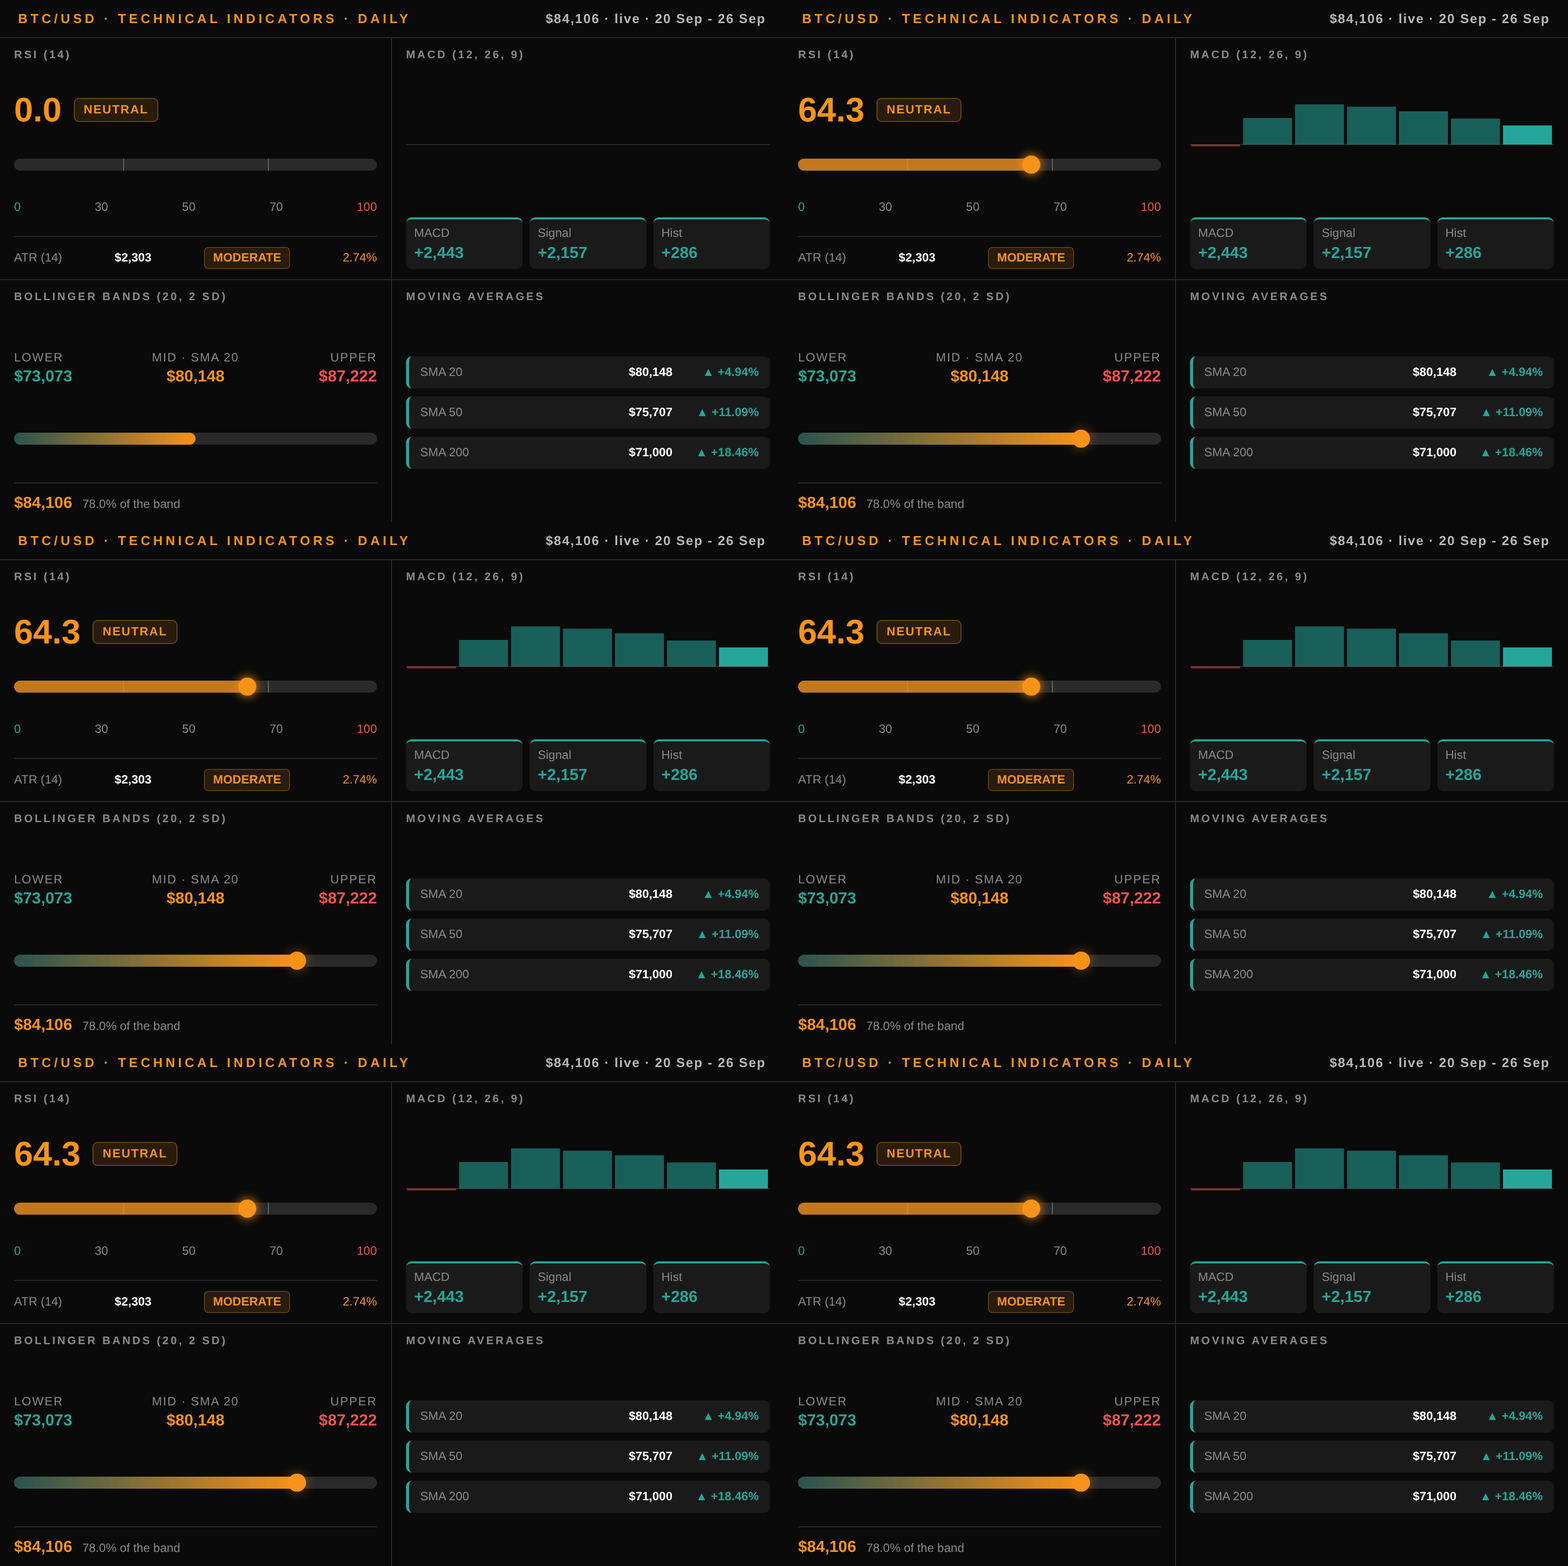
Bitcoin trades at $84,105.58 within a confirmed strong uptrend, with price action firmly positioned above the entire moving average stack. The asset sits $395.08 higher than the 20-day SMA at $80,147.50, which currently acts as immediate support, while maintaining a wider buffer above the 50-day SMA at $75,707.47 and the 200-day SMA at $70,999.96, both serving as secondary support zones. This alignment of prices above all three key averages reinforces the bullish structural bias.
Momentum indicators support this trajectory without signaling exhaustion. The Relative Strength Index holds at 64.30, indicating strong buying pressure while remaining well clear of overbought territory that would suggest an immediate reversal. Concurrently, the MACD histogram shows positive divergence with a value of 285.94, confirming that bullish momentum is actively expanding as the MACD line remains above its signal counterpart.
Volatility has moderated slightly relative to recent periods, with the Average True Range (ATR) measuring $2,302.91, or 2.74% of the current spot price. This level suggests manageable price swings rather than extreme volatility. Price action is currently contained within the Bollinger Bands, trading below the upper band at $87,222.27 and above the lower band at $73,072.73, leaving room for further upside before a mean reversion occurs.
Key levels to watch remain defined by recent price extremes. The immediate resistance target sits at the 60-day high of $87,363.76, which aligns closely with the upper Bollinger Band boundary. On the downside, traders have a substantial cushion down to the 60-day low of $62,226.58 should the current price structure fail. As the candle remains in-progress, the current price of $84,105.58 represents the real-time equilibrium as bulls defend the moving average cluster and test the resistance threshold ahead of the October CPI release.
Flows and ETF Demand
Institutional demand remains the primary anchor for Bitcoin’s current price action, driven entirely by robust inflows into US spot exchange-traded funds. The data shows a seamless seven-day streak of positive net flows, accumulating $2385.8 million over the week ending September 25. This consistent capital injection underscores a sustained appetite from traditional finance vehicles rather than speculative trading alone.
The daily contribution on September 25 stood at $134.5 million, reflecting continued momentum following the previous six days of accumulation. Cumulative inflows since launch have now reached $57,615.5 million, marking a significant shift in the asset's composition of ownership. BlackRock’s IBIT continues to lead the charge as the dominant vehicle, absorbing $1,157.6 million of the weekly total. Fidelity’s FBTC followed with substantial inflows of $701.6 million, while ARK 21Shares contributed an additional $294.7 million. Other issuers including MicroStrategy-backed funds, Grayscale, and Franklin Templeton also registered positive net flows for the period.
It is critical to interpret these flows within their correct context. While GBTC (Grayscale Bitcoin Trust) recorded a net inflow of $3.3 million this week, historical data often shows outflows from this specific vehicle. Those redemptions are mechanical and fee-driven, reflecting ongoing share redemption processes rather than a negative shift in market sentiment or a withdrawal of confidence in the asset class.
The breadth of participation across major issuers suggests the current price level is supported by deep institutional liquidity. With total US crypto ETF flows remaining firmly positive, the demand side continues to offset selling pressure from miners and short-term holders, reinforcing the structural bullish bias observed in the underlying price action as the market approaches the October CPI release.
Derivatives and Positioning
Perpetual funding rates on Binance indicate that longs are currently paying shorts 0.00493% every eight hours, an annualized cost of 5.4%. This rate sits slightly above the 7-day average of 0.00455%, signaling a modest but active tilt toward bullish speculation among leverage traders. The crowd is leaning long with a 1.30 long-to-short account ratio, where retail participants hold a 56.53% position compared to 43.47% for shorts. Despite this net-long bias, open interest has contracted, dropping 8.31% over the last week to $8 billion in USD value (95,211 BTC). This pullback in total locked capital suggests that traders are deleveraging rather than accumulating aggressively, which tempers immediate squeeze risks despite the crowded long positioning.
Institutional positioning on the CME futures market tells a similar story of sustained bullish exposure without excessive fragility. The latest COT report from September 22 shows non-commercial traders holding a net long position of 2,756 contracts, an increase of 807 positions over the prior four weeks. Commercial traders remain net short at -3,109 contracts, maintaining their traditional hedging role against spot price volatility. The combination of CME net longs rising while Binance open interest falls suggests a divergence in leverage behavior between retail derivatives and institutional futures markets.
With funding rates positive but not at levels historically associated with overheating, and open interest retreating from higher levels, the probability of a violent long squeeze diminishes. However, the 1.30 ratio indicates that a significant portion of market liquidity is already positioned for upside; any sharp downside move could trigger forced liquidations in a cascading manner. Traders should monitor whether funding rates spike further as price approaches the $87,363 resistance level, as that would signal an overextension of leverage relative to the underlying spot demand.
Network and Cycle
Bitcoin's network fundamentals present a mixed signal of underlying resilience against short-term cooling. The current hash rate sits at 884,318,253 hashes per second, though this represents a -6.97% dip from the 30-day average of 930,521,667, suggesting a temporary miner capitulation or maintenance window rather than a structural collapse. This pullback is scheduled to adjust soon, with difficulty retargeting expected on October 3 at block height 969,696 (1,017 blocks away). The protocol estimates a -3.79% reduction in the upcoming adjustment as the network attempts to recalibrate mining costs against the current price action.
Despite the hashrate fluctuation, user activity remains robust. Active addresses have climbed 3.77% over the last month to 671,438 daily users, while transaction volume holds at 600,211 txs, indicating sustained organic demand for settlement layers. Fee markets remain compressed to support this throughput; the mempool shows 1.0 sat/vbyte for half-hour and hour-confirmation times, with "fastest" execution available at 3.0 sat/vbyte. This low-cost environment facilitates high-frequency trading and micro-transactions without burdening users during periods of elevated volume.
Cycle positioning places Bitcoin deep within epoch four, specifically at the 61.28% progress mark toward the next halving event projected for April 13, 2028, with 81,321 blocks remaining. Daily issuance remains fixed at 450 BTC against a total supply of 20,089,276, representing 95.66% of the ultimate cap. While several key valuation indicators including MVRV, NUPL, and realized price are currently unavailable, the current state implies a maturation phase where network growth is decoupled from immediate price appreciation. The divergence between a -6.97% hashrate correction and rising address counts suggests the market is filtering weak participants while maintaining active participation, a common characteristic of mid-cycle consolidation before the next supply shock reduces issuance further.
Macro and Correlation
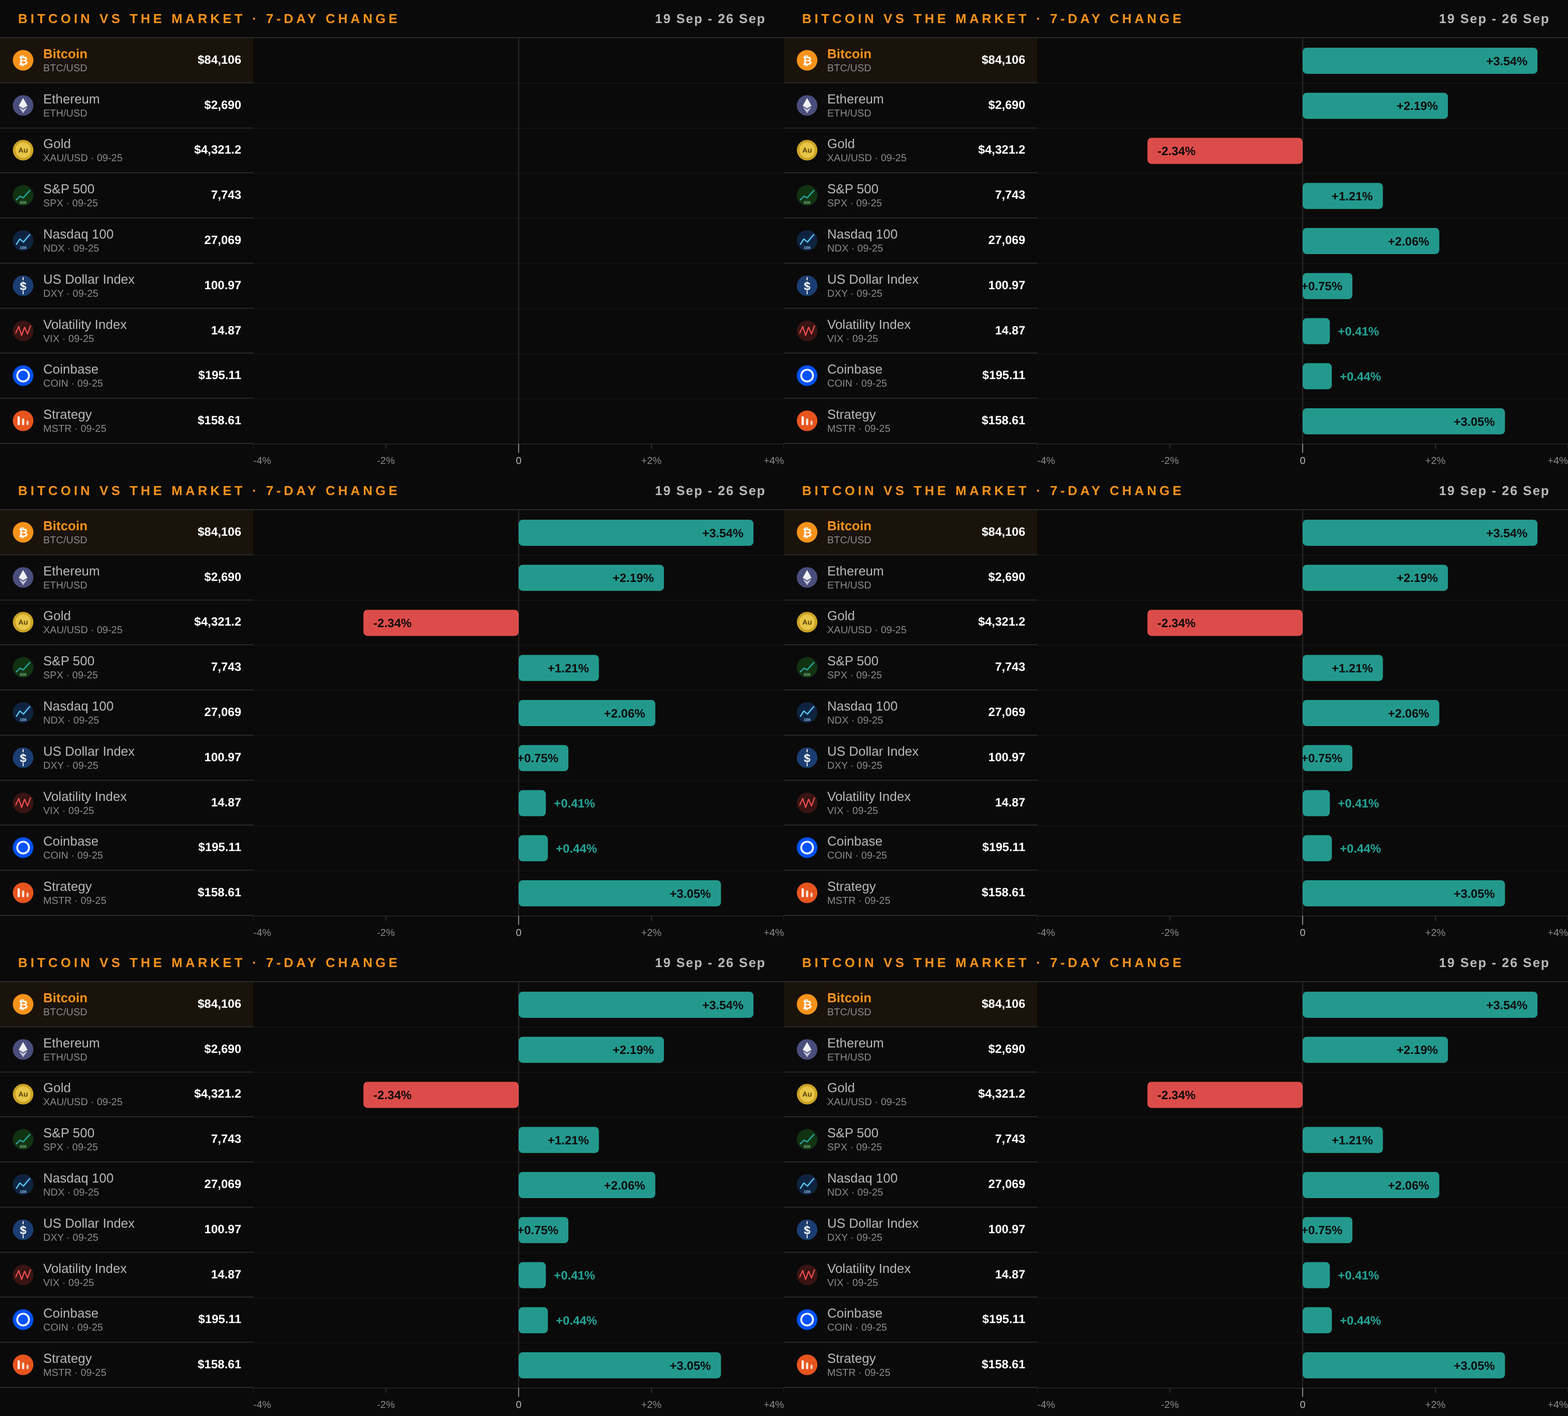
Bitcoin’s current valuation trades within a constrained macro backdrop where policy remains restrictive. The Federal Funds rate holds at 3.63%, while the real yield on the 10-year Treasury sits at 2.850%, presenting a positive real-rate environment that historically competes with non-yielding assets. Liquidity dynamics are equally tight; the Fed balance sheet stands at $6,747,704 million, yet the reverse repo facility has collapsed to just $0.576 billion. This near-zero buffer suggests a scarcity of excess cash in the system, forcing capital allocation decisions to become more binary and selective. Against this backdrop, the US Dollar Index (DXY) is up 0.75% over the week to 100.97, creating a headwind that typically suppresses crypto prices, yet Bitcoin has shown relative resilience.
The correlation matrix reveals which relationships are actively defining price action today rather than relying on historical averages. Bitcoin maintains its strongest statistical link with Ether, showing a 90-day correlation coefficient of +0.875, confirming that altcoin volatility continues to trail the leader closely. MicroStrategy (MSTR) also tracks with a +0.801 coefficient, indicating that corporate treasury plays are still moving in lockstep with Bitcoin rather than decoupling. Conversely, the relationship with the broader technology sector has weakened slightly; the Nasdaq 100 (NDX) correlation stands at +0.401 and the S&P 500 (SPX) at +0.388, suggesting that recent price action is driven more by internal crypto fundamentals than broad equity sentiment shifts.
Notably, the inverse relationship with the dollar persists but has softened; BTC holds a -0.394 correlation against the DXY, meaning the asset is not currently moving in perfect lockstep with dollar weakness. Similarly, gold’s correlation remains positive at +0.522, reinforcing Bitcoin's evolving narrative as an alternative store of value that shares some properties with precious metals during this specific cycle phase.
Upcoming Catalysts
The immediate macro landscape is defined by a cluster of critical US data releases scheduled to test the current $84,000 equilibrium before the month's end. Bitcoin's trajectory will likely pivot on how these figures align with market expectations for liquidity and inflation. The following events represent the primary drivers for volatility over the coming weeks:
- US Gross Domestic Product — 2026-09-30: A key gauge of economic expansion that sets the baseline for Fed policy, directly influencing risk appetite in digital assets.
- US Non-Farm Payrolls — 2026-10-02: Labor market strength often dictates the pace of monetary tightening or easing, creating immediate volatility for rate-sensitive collateral like Bitcoin.
- US Consumer Price Index — 2026-10-14: The primary measure of inflation; deviations from consensus here will be the decisive factor for real yield calculations and dollar direction.
- US Producer Price Index — 2026-10-15: A forward-looking indicator of wholesale inflation pressures that often precedes consumer data, offering early signals on future price stability.
Trade Idea
The established bullish bias within the strong uptrend supports a long setup targeting a breakout above the immediate resistance zone. Current price action at $84,105 remains supported by the SMA 20 near $80,147, but momentum is directed toward the 60-day high level of $87,363.76, which also aligns closely with the upper Bollinger Band at $87,222.27.
Given the Average True Range (ATR) indicates a typical daily volatility of roughly 2.74% or $2,302.91, risk management requires a stop-loss placed below the recent structural support to avoid standard market noise.
Entry: $84,105 (current price level) Stop-Loss: $81,600 (approximately 1 ATR below entry, well above the SMA 20 at $80,147) Target: $87,364 (tested resistance level of the 60-day high)
This configuration offers a risk-to-reward ratio exceeding 1:1. The distance to the stop ($2,505) is less than half the distance to the target ($3,259), ensuring the trade is mathematically viable if price breaks the consolidation range while maintaining the trend's integrity.
Price Outlook and FAQ
With Bitcoin trading at $84,105.58, the immediate one-week trajectory is defined by volatility ranging between $81,800 and $87,400. This range construction utilizes the Average True Range of $2,302.91 to estimate standard deviation bands from current levels, creating a probabilistic floor near the upper SMA 50 support zone and a ceiling approaching the Bollinger Bands' upper bound of $87,222. The resistance level at $87,363.76 marks the 60-day high; a sustained close above this threshold would be required to extend gains beyond the immediate volatility cap. Conversely, the SMA 20 acts as the first line of defense at $80,147.50. While the trend remains a strong uptrend, the ATR suggests that intraday swings of approximately 2.7% from the current price are statistically probable over the next week. Traders should monitor whether the asset holds above $81,800 or tests the support cluster near $80,147 to determine if the momentum accelerates or experiences a cooling off period. The lack of negative ETF flows and positive funding rates suggests that any dip toward $80,000 is likely to find buying interest rather than trigger a collapse.
Is Bitcoin currently overbought? No, the Relative Strength Index stands at 64.30, which sits comfortably below the traditional 70-level threshold for overbought conditions. This reading indicates that while momentum is positive and aligned with the uptrend, there remains room for further price appreciation before technical exhaustion sets in. The MACD histogram remains positive at 285.94, confirming that buying pressure has not yet peaked.
How does the derivatives market positioning affect short-term moves? The long-to-short ratio of 1.3004 suggests a net long bias among traders, supported by funding rates where longs pay shorts an annualized 5.4%. This indicates that the crowd is aggressively betting on continued upward movement, with no immediate signs of a squeeze in the opposite direction. However, the 8.31% drop in open interest over the last week suggests some leverage has been removed, potentially allowing for smoother price discovery without excessive volatility.
What are the critical data points to watch this month? Investors should focus on the US Consumer Price Index release on October 14 and the preceding US Non-Farm Payrolls report on October 2. These macroeconomic events often dictate liquidity conditions, which currently support a "Greed" sentiment reading of 74 in the Fear & Greed Index. Given the current ETF inflow streak of seven days, these data points will likely determine if institutional flows accelerate or pause their current pace.
Disclaimer: This article is for informational purposes only and does not constitute financial advice. Cryptocurrency trading carries a high level of risk and may not be suitable for all investors. Past performance is not indicative of future results. Always conduct your own research before making investment decisions.
Key Takeaways
- The market retains a bullish bias as Bitcoin trades at $84,105 above its 20-, 50-, and 200-day moving averages within a confirmed strong uptrend.
- Institutional demand remains the primary driver, evidenced by a seven-day inflow streak totaling $2.39 billion in ETF flows led by BlackRock and Fidelity.
- Derivatives data shows leverage leaning toward bulls, with retail traders holding a 1.30 long-to-short ratio while paying shorts 5.4% annualized funding fees.
- Technical structure points to $87,363 as the next resistance level, currently capped by Bollinger Bands at $87,222 amidst a 74 reading on the Fear & Greed Index.
- Investors should prepare for volatility ahead of the US Consumer Price Index release on October 14 and note that hashrate has dipped 6.97% over the last month.
Your Gateway to Crypto Markets
 BEST 2026
Start investing in BITCOIN from $20 with 0% commissions
 SINCE 2008
Trade BITCOIN like a professional from $100
* 74-89% of retail investor accounts lose money when trading CFDs with this provider. You should consider whether you understand how CFDs work and whether you can afford to take the high risk of losing your money.